
PCA Analysis of Cryto-Currency Market (phase 1)
(this text is essential copied from http://www.statstec.x10host.com/page_stats.html)
It is well known in crypto currency markets that when Bitcoin moves up or down the rest of the market follows, mostly. Principal component analysis (PCA) can help determine how much of the market movement is correlated. Some groups of coins such as Ethereum, NEO, and at times DASH and Monero have moved differently from Bitcoin. These different groups can be identified (to some degree) in the eigen vectors of the PCA. For each eigen vector, the amplitude coefficients show its dominance in the market at any given time. This analysis uses the covariance matrix of the normalized dataset (as plotted above). Please wait for the data to load, execute the analysis and view the results below.
(2018-02-11) Results discussion -
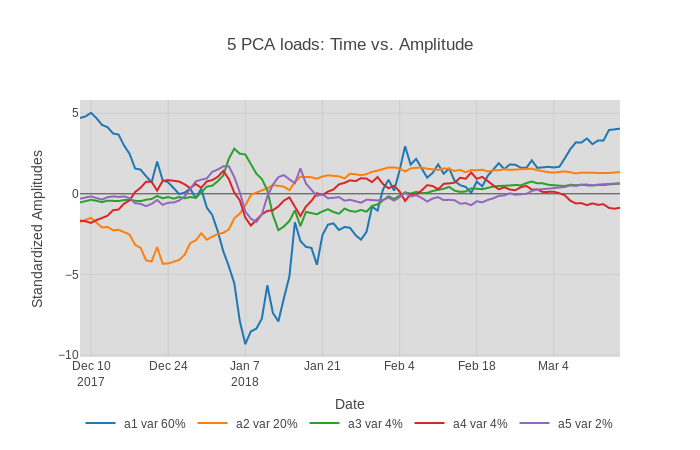
- Essentially, a centred version of the normalized data set can be rebuilt by multiplying the eigenvectors (EG) by their amplitude scores (a). From the results, 93% of the information can be reconstructed with 4 eigenvectors. In the plot above, the zero value of the amplitude curves represents a mean (sort of).
- EG1 represents 76% of variations in the market. The coefficients of EG1 are all negative for every coin, except for Tether. It represents correlated market movements and perhaps indirectly money in the market.
- EG2 represents 10% of variations in market. Here Ethereum, NEO, Stellar, Steem, and a few others are negatively correlated to Bitcoin. Amplitude curve 2, a2, represent a certain proportion of money that moves toward or away from these coins to the others. (similar analysis applies to EG3)
- Since Tether is constantly 1, it does not correlate with anything
- Bitcoin price peaked around Dec. 18, then again on Jan. 7. The Dec. 10 peak appears to have been supported by money moving in from altcoins. Since Dec 10, money has been moving into the altcoins in EG2. This trend appears to have reached a maxima (curve 'a2' above).
- Money appears to have been moving into the market until peaking at Jan. 7. Since, the value has dropped down to the three month mean (curve 'a1' above).
(2018-03-10) Results discussion -
- While'EG1' applies to all the coins, it appears to track mostly the big alt-coin bump. The blue curve has a range of 5 to -10, essentially changing 15 units. Ripple went from $.22 to $3.00, and Stellar from $.05 to $0.9! Thus, the BTC coefficient in 'EG1' is quite low, since it only doubled in price.
- The PCA analysis seem to suggest relative period of calm over the last two weeks of February are over and prices appear to be heading to undo the big movements seen in early December. Alts, having climbed higher, have harder fall.
- 'Death of Shitcoins', I think, but ETH and EOS (and group) will keep relative gains in market share. That is, it appears like the green, red, and even blue (to a lesser degree) curves (a3, a4, and a1, respectively) are heading back to where they were in early December. 'a2', the orange curve, does not appear to be returning to values of early December (see 'EG2' above).
- This reversal back to the state of early December appears slow, where 1 month is equivalent to 1 week. There appears to be another month to go.
- The green curve, 'a3', is where Ripple, Lisk and Nano are dominant and have negative correlations with Bitcoin. As it returns to the values in early December, people will be selling for Bitcoin, and prices will drop for these alts by a similar multiplier. This appears to be gaining momentum.
- All that being said, if the money moves out of alts and stays in Bitcoin for a even a short time, this can pump the price of BTC. While this effect appears considerable, BTC at more than $11500 does not seem possible. (For example, the value of the yellow curve in mid late December that helped drive BTC to $20000).
- Recently, there was an announcement that there would be a NASDAQ indexed crypto fund. The impact of the CME announcement in December 2016 drove the crypto market to incredible heights. However, it appears that crypto investors simply did not understand the futures market nor anticipate USD settlements. The futures markets have relatively low volumes and the spot price has only been dropping. Nevertheless, this should support a higher bottom price for the crypto market.
| Eigenvectors: | |||||
| Coin | Vector 1 | Vector 2 | Vector 3 | Vector 4 | Vector 5 |
| Ethereum | -0.058 | 0.037 | -0.051 | 0.044 | -0.027 |
| Bitcoin | -0.018 | -0.106 | -0.003 | -0.074 | -0.027 |
| Ripple | -0.13 | -0.056 | 0.197 | 0.093 | 0.228 |
| Bitcoin | -0.062 | -0.155 | -0.02 | 0.052 | -0.026 |
| Litecoin | -0.015 | -0.09 | 0.023 | 0.003 | -0.049 |
| NEO | -0.05 | 0.114 | -0.075 | 0.136 | 0.012 |
| Stellar | -0.099 | 0.061 | 0.028 | 0.113 | 0.087 |
| Cardano | -0.136 | -0.041 | 0.035 | 0.094 | 0.126 |
| Dash | -0.049 | -0.137 | -0.007 | 0.032 | -0.04 |
| Monero | -0.037 | -0.055 | 0.01 | 0.011 | 0.009 |
| IOTA | -0.036 | -0.171 | -0.062 | -0.097 | -0.048 |
| Tether | 0.001 | -0.003 | -0.002 | -0.005 | 0 |
| NEM | -0.132 | -0.099 | -0.006 | -0.016 | 0.049 |
| VeChain | -0.068 | 0.19 | -0.078 | 0.156 | -0.031 |
| TRON | -0.176 | -0.001 | 0.293 | -0.028 | 0.087 |
| Ethereum | -0.03 | -0.036 | -0.004 | 0.048 | -0.057 |
| Lisk | -0.061 | 0.031 | 0.028 | 0.149 | -0.106 |
| Nano | -0.142 | 0.056 | 0.173 | 0.058 | 0.288 |
| EOS | -0.064 | 0.007 | -0.118 | 0.131 | -0.048 |
| OmiseGO | -0.056 | 0.002 | 0.025 | 0.039 | 0.031 |
| Qtum | -0.098 | -0.12 | 0.049 | 0.154 | -0.005 |
| Bitcoin | -0.046 | -0.207 | -0.097 | -0.025 | -0.069 |
| Binance | -0.113 | 0.086 | -0.021 | -0.027 | 0.053 |
| ICON | -0.139 | 0.033 | -0.113 | 0.037 | -0.029 |
| Steem | -0.086 | 0.037 | 0.007 | 0.156 | -0.001 |
| DigixDAO | 0.031 | 0.138 | 0.152 | 0.075 | 0.077 |
| Populous | -0.071 | -0.04 | -0.15 | 0.054 | -0.136 |
| Waves | -0.037 | -0.161 | -0.028 | -0.021 | -0.063 |
| Bytecoin | -0.133 | -0.019 | 0.081 | -0.026 | -0.068 |
| Verge | -0.134 | -0.158 | 0.073 | 0.183 | 0.022 |
| Maker | -0.046 | 0.024 | -0.1 | 0.126 | -0.044 |
| Stratis | -0.094 | -0.077 | -0.089 | -0.012 | 0.004 |
| Dogecoin | -0.116 | -0.048 | 0.083 | 0.014 | -0.023 |
| RChain | -0.087 | 0.128 | 0.083 | 0.056 | 0.008 |
| BitShare | -0.116 | -0.153 | 0.069 | 0.107 | 0.067 |
| Aeternit | -0.03 | 0.113 | 0.067 | 0.163 | -0.125 |
| Decred | -0.053 | -0.026 | -0.015 | 0.06 | -0.008 |
| Siacoin | -0.172 | 0.007 | 0.044 | -0.065 | -0.076 |
| Status | -0.141 | 0.024 | 0.077 | 0.046 | 0.131 |
| Augur | -0.087 | -0.041 | -0.103 | 0.096 | -0.056 |
| Bytom | -0.064 | 0.011 | 0.038 | 0.04 | 0.022 |
| Komodo | -0.084 | -0.13 | -0.003 | 0.132 | 0.01 |
| Waltonch | -0.037 | 0.137 | -0.18 | 0.222 | -0.136 |
| Ark | -0.081 | -0.08 | -0.061 | 0.036 | -0.027 |
| Aion | -0.131 | -0.051 | 0.045 | -0.057 | 0.056 |
| Cryptone | -0.004 | 0.079 | -0.023 | 0.122 | -0.055 |
| 0x C | -0.12 | 0.115 | -0.159 | 0.073 | -0.089 |
| Veritase | -0.074 | -0.024 | -0.073 | 0.092 | -0.069 |
| MonaCoin | 0.004 | -0.21 | -0.077 | -0.131 | -0.098 |
| Hshare | -0.048 | -0.225 | -0.017 | 0.13 | -0.094 |
| Electron | -0.088 | -0.03 | -0.079 | -0.126 | -0.091 |
| PIVX | -0.089 | -0.082 | -0.064 | 0.064 | -0.003 |
| DigiByte | -0.148 | -0.062 | 0.08 | 0.027 | 0.016 |
| KuCoin S | -0.213 | 0.14 | -0.043 | -0.174 | -0.063 |
| Golem | -0.113 | -0.101 | 0.036 | 0.022 | 0.12 |
| Revain | 0.012 | 0.178 | 0.221 | 0.297 | -0.148 |
| Factom | -0.095 | -0.052 | 0.022 | 0.014 | 0.066 |
| Gas | -0.077 | 0.067 | -0.113 | 0.078 | -0.035 |
| Basic At | -0.107 | 0.018 | -0.03 | 0.031 | -0.038 |
| Syscoin | -0.053 | -0.019 | 0.017 | 0.077 | 0.029 |
| QASH | -0.11 | 0.015 | -0.129 | -0.069 | -0.011 |
| Ethos | -0.133 | 0.072 | 0.077 | -0.062 | 0.023 |
| Loopring | -0.142 | 0.108 | -0.059 | -0.049 | -0.172 |
| Dragonch | -0.167 | 0.082 | 0.014 | -0.07 | -0.014 |
| GXChain | -0.092 | -0.036 | 0.008 | 0.046 | -0.002 |
| Emercoin | -0.092 | 0.122 | -0.176 | 0.039 | 0.074 |
| ZCoin | -0.077 | -0.108 | 0.005 | 0.112 | 0.085 |
| FunFair | -0.145 | 0 | 0.066 | -0.058 | 0.026 |
| Kin | -0.18 | 0.072 | 0.222 | -0.123 | -0.037 |
| Kyber Ne | -0.103 | 0.02 | -0.068 | 0.057 | -0.124 |
| Dentacoi | -0.247 | 0.14 | 0.004 | -0.353 | -0.358 |
| ReddCoin | -0.155 | -0.018 | 0.14 | 0.01 | 0.042 |
| ChainLin | -0.104 | 0.041 | 0.057 | -0.009 | -0.01 |
| Zcash | -0.062 | -0.062 | 0.008 | 0.023 | -0.059 |
| SALT | -0.088 | -0.18 | -0.039 | -0.045 | 0.002 |
| SmartCas | -0.182 | 0.09 | -0.541 | -0.119 | 0.504 |
| Power Le | -0.109 | -0.064 | -0.002 | 0.022 | -0.016 |
| MaidSafe | -0.096 | -0.126 | -0.015 | 0.015 | 0.048 |
| Nxt | -0.012 | -0.385 | -0.107 | 0.1 | -0.243 |
| TenX | -0.069 | -0.158 | -0.011 | 0.061 | 0.033 |
| Bancor | -0.085 | 0.034 | -0.056 | 0.025 | -0.015 |
| Byteball | -0.088 | -0.038 | -0.105 | 0.135 | 0.016 |
| Particl | -0.066 | 0.093 | -0.123 | 0.086 | 0.093 |
| Cindicat | -0.067 | 0.175 | -0.047 | 0.282 | -0.195 |
| Request | -0.146 | -0.025 | 0.073 | -0.028 | 0.107 |
| Iconomi | -0.11 | -0.044 | 0.023 | -0.056 | -0.011 |
| Dent | -0.185 | 0.061 | 0.114 | -0.078 | -0.057 |
| Neblio | -0.138 | 0.145 | -0.073 | -0.141 | -0.146 |
| Bitcore | -0.044 | 0.026 | -0.045 | 0.103 | -0.043 |
| Nexus | -0.165 | -0.019 | 0.058 | -0.21 | -0.068 |