Scalar Field PCA of Hurricanes affecting the Maritime Regions of Canada (Preliminary Study)
by
Reza Erfani, PhD
Luc Chouinard, ScD
Introduction
A tropical cyclone is a vigorous storm system that has a low pressure centre that is driven by the hot humid conditions over the tropical oceans. These storm systems range in intensity from tropical depressions, which have winds below gale strength (less than 63 km/h), to intense hurricanes and typhoons, which can have winds exceeding 250 km/h (cited from https://www.ec.gc.ca/ouragans-hurricanes/default.asp?lang=En&n=77977664-1). Tropical cyclones have intense and devastating rainfall accumulations of hundreds of millimeters over only a few hours. In addition to the wind and rain, tropical cyclones can also produce high waves and damaging storm surge. They can even spawn tornadoes.
Impacts to communities can include uprooted trees, snapped power poles, damaged roofing and building cladding, broken signage, toppled fences and overturned trucks. In Newfoundland, roadways have been undermined and low lying lands have been inundated. On the coast, damage includes over-wash and wave-breaking to breakwaters and small structures. About 30% of insurance losses around the world are related to tropical cyclones.
This work here is a preliminary study using principal component analysis to hurricane events, identified by Canadian Hurricane Center, to identify physical phenomena of hurricane events and to better evaluate the risk.
Objectives
The objectives are to develop anomaly maps of sea level pressure data for hurricanes affecting the maritime region of Canada and perform PCA analysis on this data to:
1. Obtain principal components and scores of the data set
2. Study possible physical characteristics contained in these results
3. Study the potential of these results to contribute to the understanding of the hurricane phenomena and the estimation of hurricane risk.
Methodology
This work has three steps:
1. Identify historical hurricane events that have affected the maritime regions of Canada,
2. Creation of 4 anomaly maps for each event at 24 hr intervals (T-72, T-48, T-24, T-0),
3. Obtain wind records during for each event.
4. Preform PCA analysis of storm anomaly maps, and
5. Clustering of anomaly maps evaluate clusters
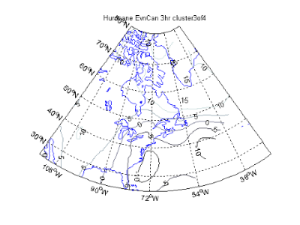
Storms are identified using the dataset compiled by Environment Canada available from the Canadian Hurricanes Center archives website. They provide all information statements issued by the Canadian Hurricane Centre since 2003.
Anomaly maps of mean seal level pressure are constructed for every 3-hr interval of each hurricane event using NARR data set.
Wind speed is used a secondary variable to evaluate clusters of the anomaly maps, based on sea level pressure. For simplicity, a wind speed associated with the event is obtained by taking the maximum wind speed occurring in the region between 60° to 90° degrees West at 30° North to 30° West to 70° West at 55° North, along the East coast of North America, from the NARR data. It is presumed that the maximum wind speed is associated with the hurricane event. The second stage of this research, of the associated wind speed will be assessed more accurately.
Results
There were 42
storms in total with durations of 72 hours.
PC
Analysis
First
4 PCs account for 46% of variation, an
first
10 PCs account for 69% of variation.

These
results appear promising in that PCs are able to isolate variations in extra
tropical areas from moving hurricane centers. Continental weather and synoptic
features east of the 40W longitude are also separated.
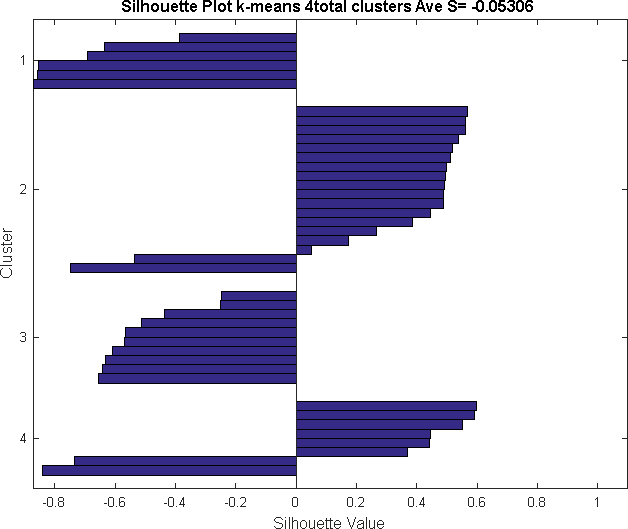
4-clusters:
Clusters 1 and 3 clusters have good silhouette profiles and form coherent average anomaly maps. Cluster
1 features hurricanes that track from the Atlantic ocean over the continent and
up to Ontario and Hudson Bay.
Cluster
3 features hurricanes tracking along the coast.
Figure 1: Cluster 1
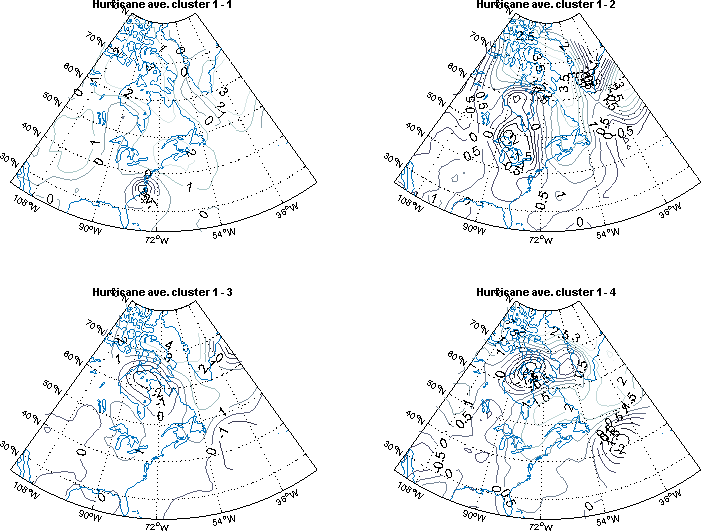
Figure 2: Cluster 2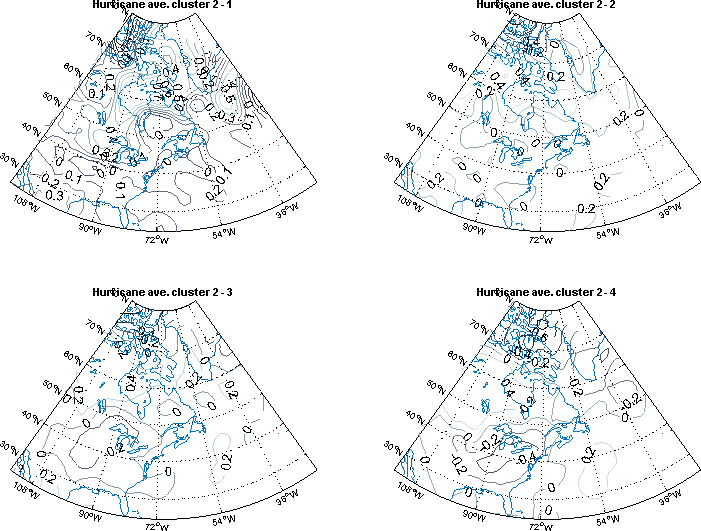
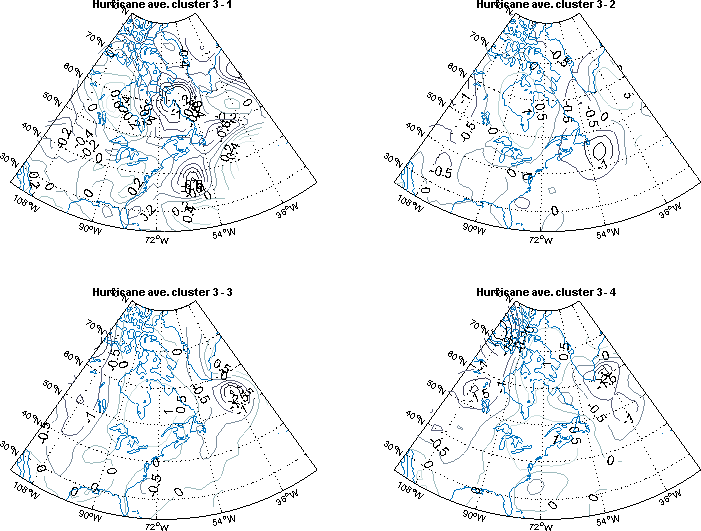
Figure 4: Cluster 4
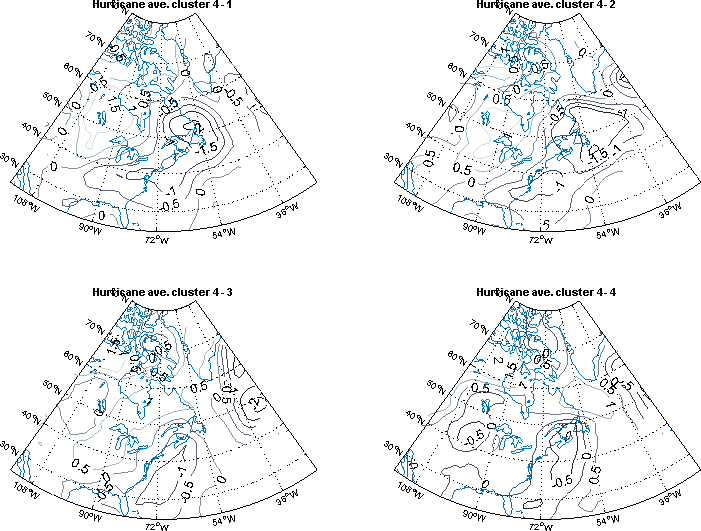
Figure 5: Wind Speed 4-Cluster Box Plots
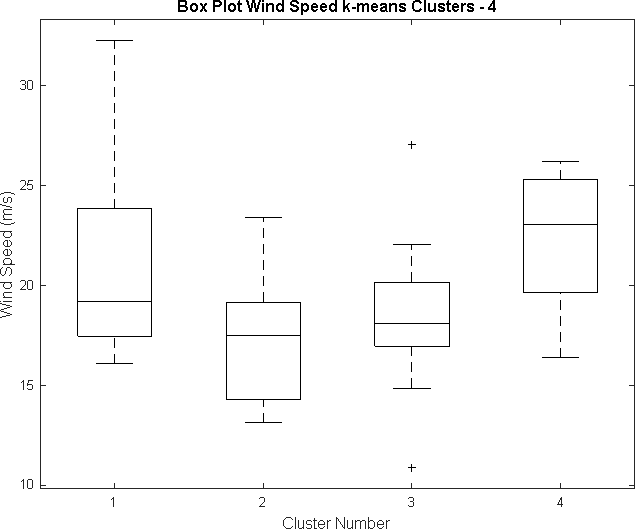
Figure 6, Silhouette plot of clusters