
Patterns of Shifting Voter Support for Canadian Political Parties
Correlations of Shifting Voter Support for Canadian Political Parties
By Reza Erfani
August 2 /2015
Executive Summary
Voters’ support for political parties often shift over time. The amount of changing support is often a topic of hot debate. Statistical methods can help quantify the correlated wins and gains of the different political parties, so as to bring precision to those discussion. In this work, national opinion poll data from 2006 to present is analyzed using Principal Components Analysis. In this method, the correlations found in the data set are grouped together, ultimately describing the data in terms independent groups of correlated behaviors. Organized in this way, the transformed data set describes the information as efficiently as possible. These groups and their contribution over time often reveal underlying relationships in the data set.
After preforming the analysis, 2 groups of ‘relationships’ are found that describe 85% of the variations (changes) in the support for the different political parties. The first group is called the “NDP key”, by the author, since the NDP plays a feature role in this group. In this ‘relationship’, for a +86 unit change in support for the NDP there is a corresponding -43, -18, and -19 change for the Liberal Party (LPC), Bloc, and Green, respectively. This relationship accounts for 55% of all the variability in the data set, and is most significant since May 2011. It should be noted that this relationship also goes both ways; a decrease in support for the NDP leads to a proportional increase for the other parties. The Conservative Party are not featured in this group. This is important since, at times when this relationship is dominant, the support for the Conservatives (Cons) is almost completely unaffected.
The second most significant group accounts for 30% of all the variation (changes) in the data set. It suggests that for a +71 and +24 unit change for the LPC and the NDP, respectively, there is a -60 unit change for the Cons and a -21 and -16 unit change for Bloc and Green respectively. Group 2 has an almost 1 to 1 relationship between the Cons and the LPC. This is significant since this is the only dynamic where the LPC can win support from the Conservatives. This second group, has had sustained significance since April 2013, after the election of Justin Trudeau as LPC leader.
From these results, a strategy clearly suggests itself, whereby the LPC could enable the ‘help’ of the Bloc and Green Party to weaken the support for the NDP, while at the same time exploiting the popularity of the Trudeau name and the ‘Old Party’ brand to win support from the Cons. This could produce positive results for the LPC.
Correlations of Shifting Voter Support for Canadian Political Parties
When following opinion polls, we often contemplate and discuss how support moves from one political party to another. In the 2011 election, we saw the NDP’s popularity increase at the expense of the Liberal Party and the Bloc. We also know that third parties can take support from one of the two leading parties. A question remains as to how large are these effects. Also, as the effects overlap in time, it is difficult to differentiate the contribution of each effect to the overall support for a party. As these relationships are negative correlations in support for political parties, multi-variate statistics can offer some answers to these questions.
In this work national opinion poll data since 2006 to present is analyzed using a multi-variate statistical method called Principal Components Analysis. In this method, the correlations found in the data set are grouped together, ultimate describing the data in terms of independent groups of correlated behaviors. Organized in this way, the transformed data set describes the information as efficiently as possible. These groups, and their contribution over time, often reveal underlying relationships in the data set.
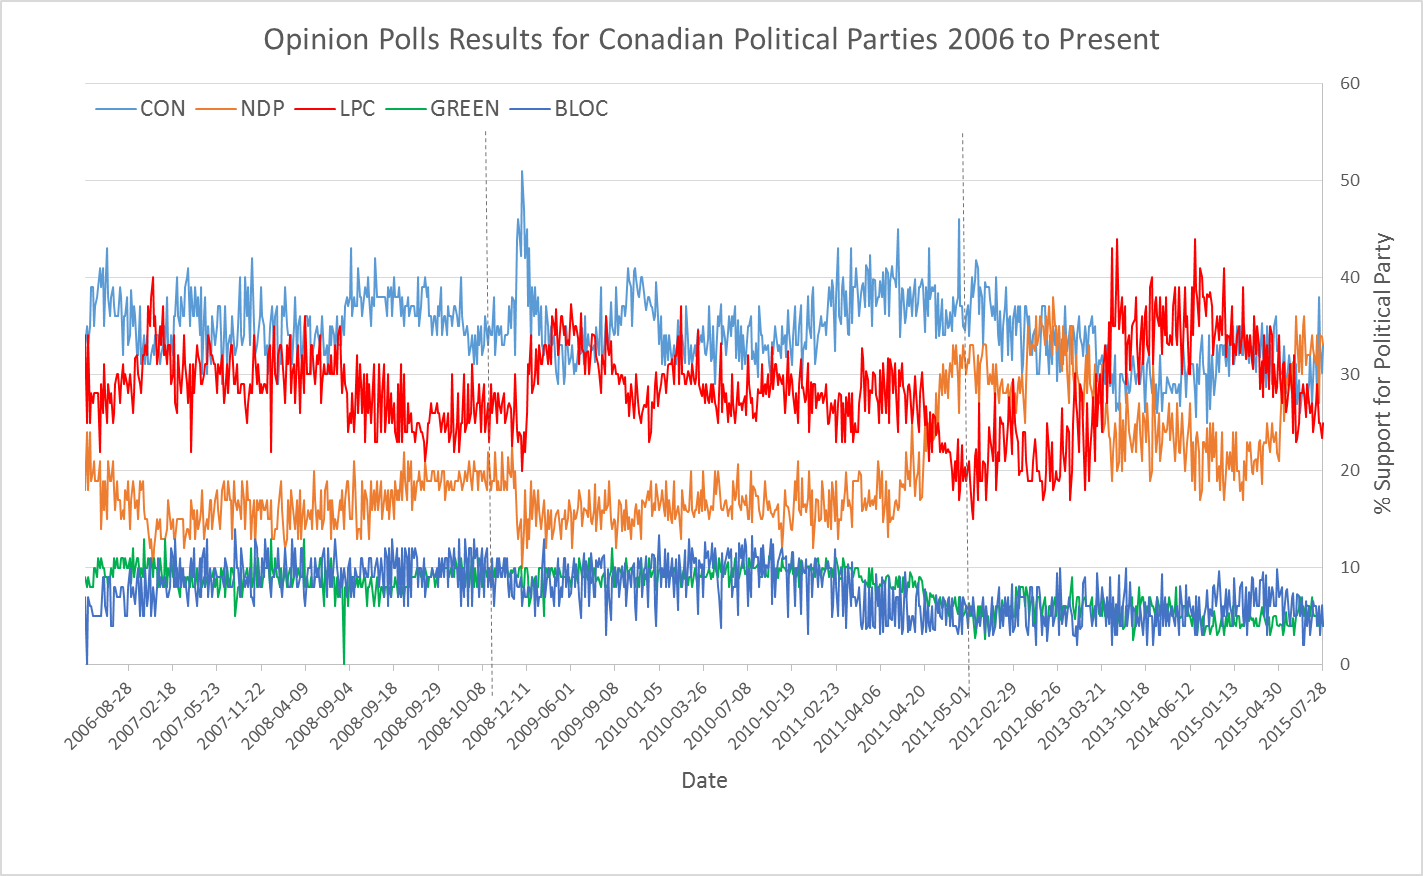
Figure 1 shows the untransformed data set of opinion polls of support for the different political parties (Cons, NDP, LPC, Bloc, and Green) from 2006 to present. Important dates to keep in mind are May 2 2011, October 14 2008, and January 3 2006, the dates of the previous national elections.
Figure 1: Opinion Polls political Party Support 2006 to Present
After preforming the analysis, 3 groups of ‘relationships’ are found that describe 95% of the variations (changes) in the support for the different political parties. The first group is called the “NDP key”, by the author, since the NDP plays a feature role in this group. In this ‘relationship’, for a +86 unit change in support for the NDP there is a corresponding -43, -18, and -19 change for the LPC, Bloc, and Green, respectively. This relationship accounts for 55% of all the variability in the data set (from 20006 to present). It should be noted that this relationship also goes both ways; a decrease in support for the NDP leads a proportional increase for the other parties. The Conservative Party (Cons) are not featured in this group. This is important since, at times when this relationship is dominant, the support for Cons remain unaffected.
The second most significant group accounts for 30% of all the variation (changes) in the data set. It suggest that for a +71 and +24 unit change for the LPC and the NDP, respectively, there is a -60 unit change for the Cons and a -21 and -16 unit change for Bloc and Green respectively. Group 2 has an almost 1 to 1 relationship between the Cons and the LPC, and is therefore called the “Cons Key”. This is significant since this is the only dynamic where the LPC can win support from the Conservatives.
The third group accounts for 11% of the variations in the data. It shows a -63 change for Cons corresponds to a +60 for the Green party. While this relationship is not surprising, it is clearly not significant and is not pursued further.
Figure 2: Amplitudes of Change Relationships over Time
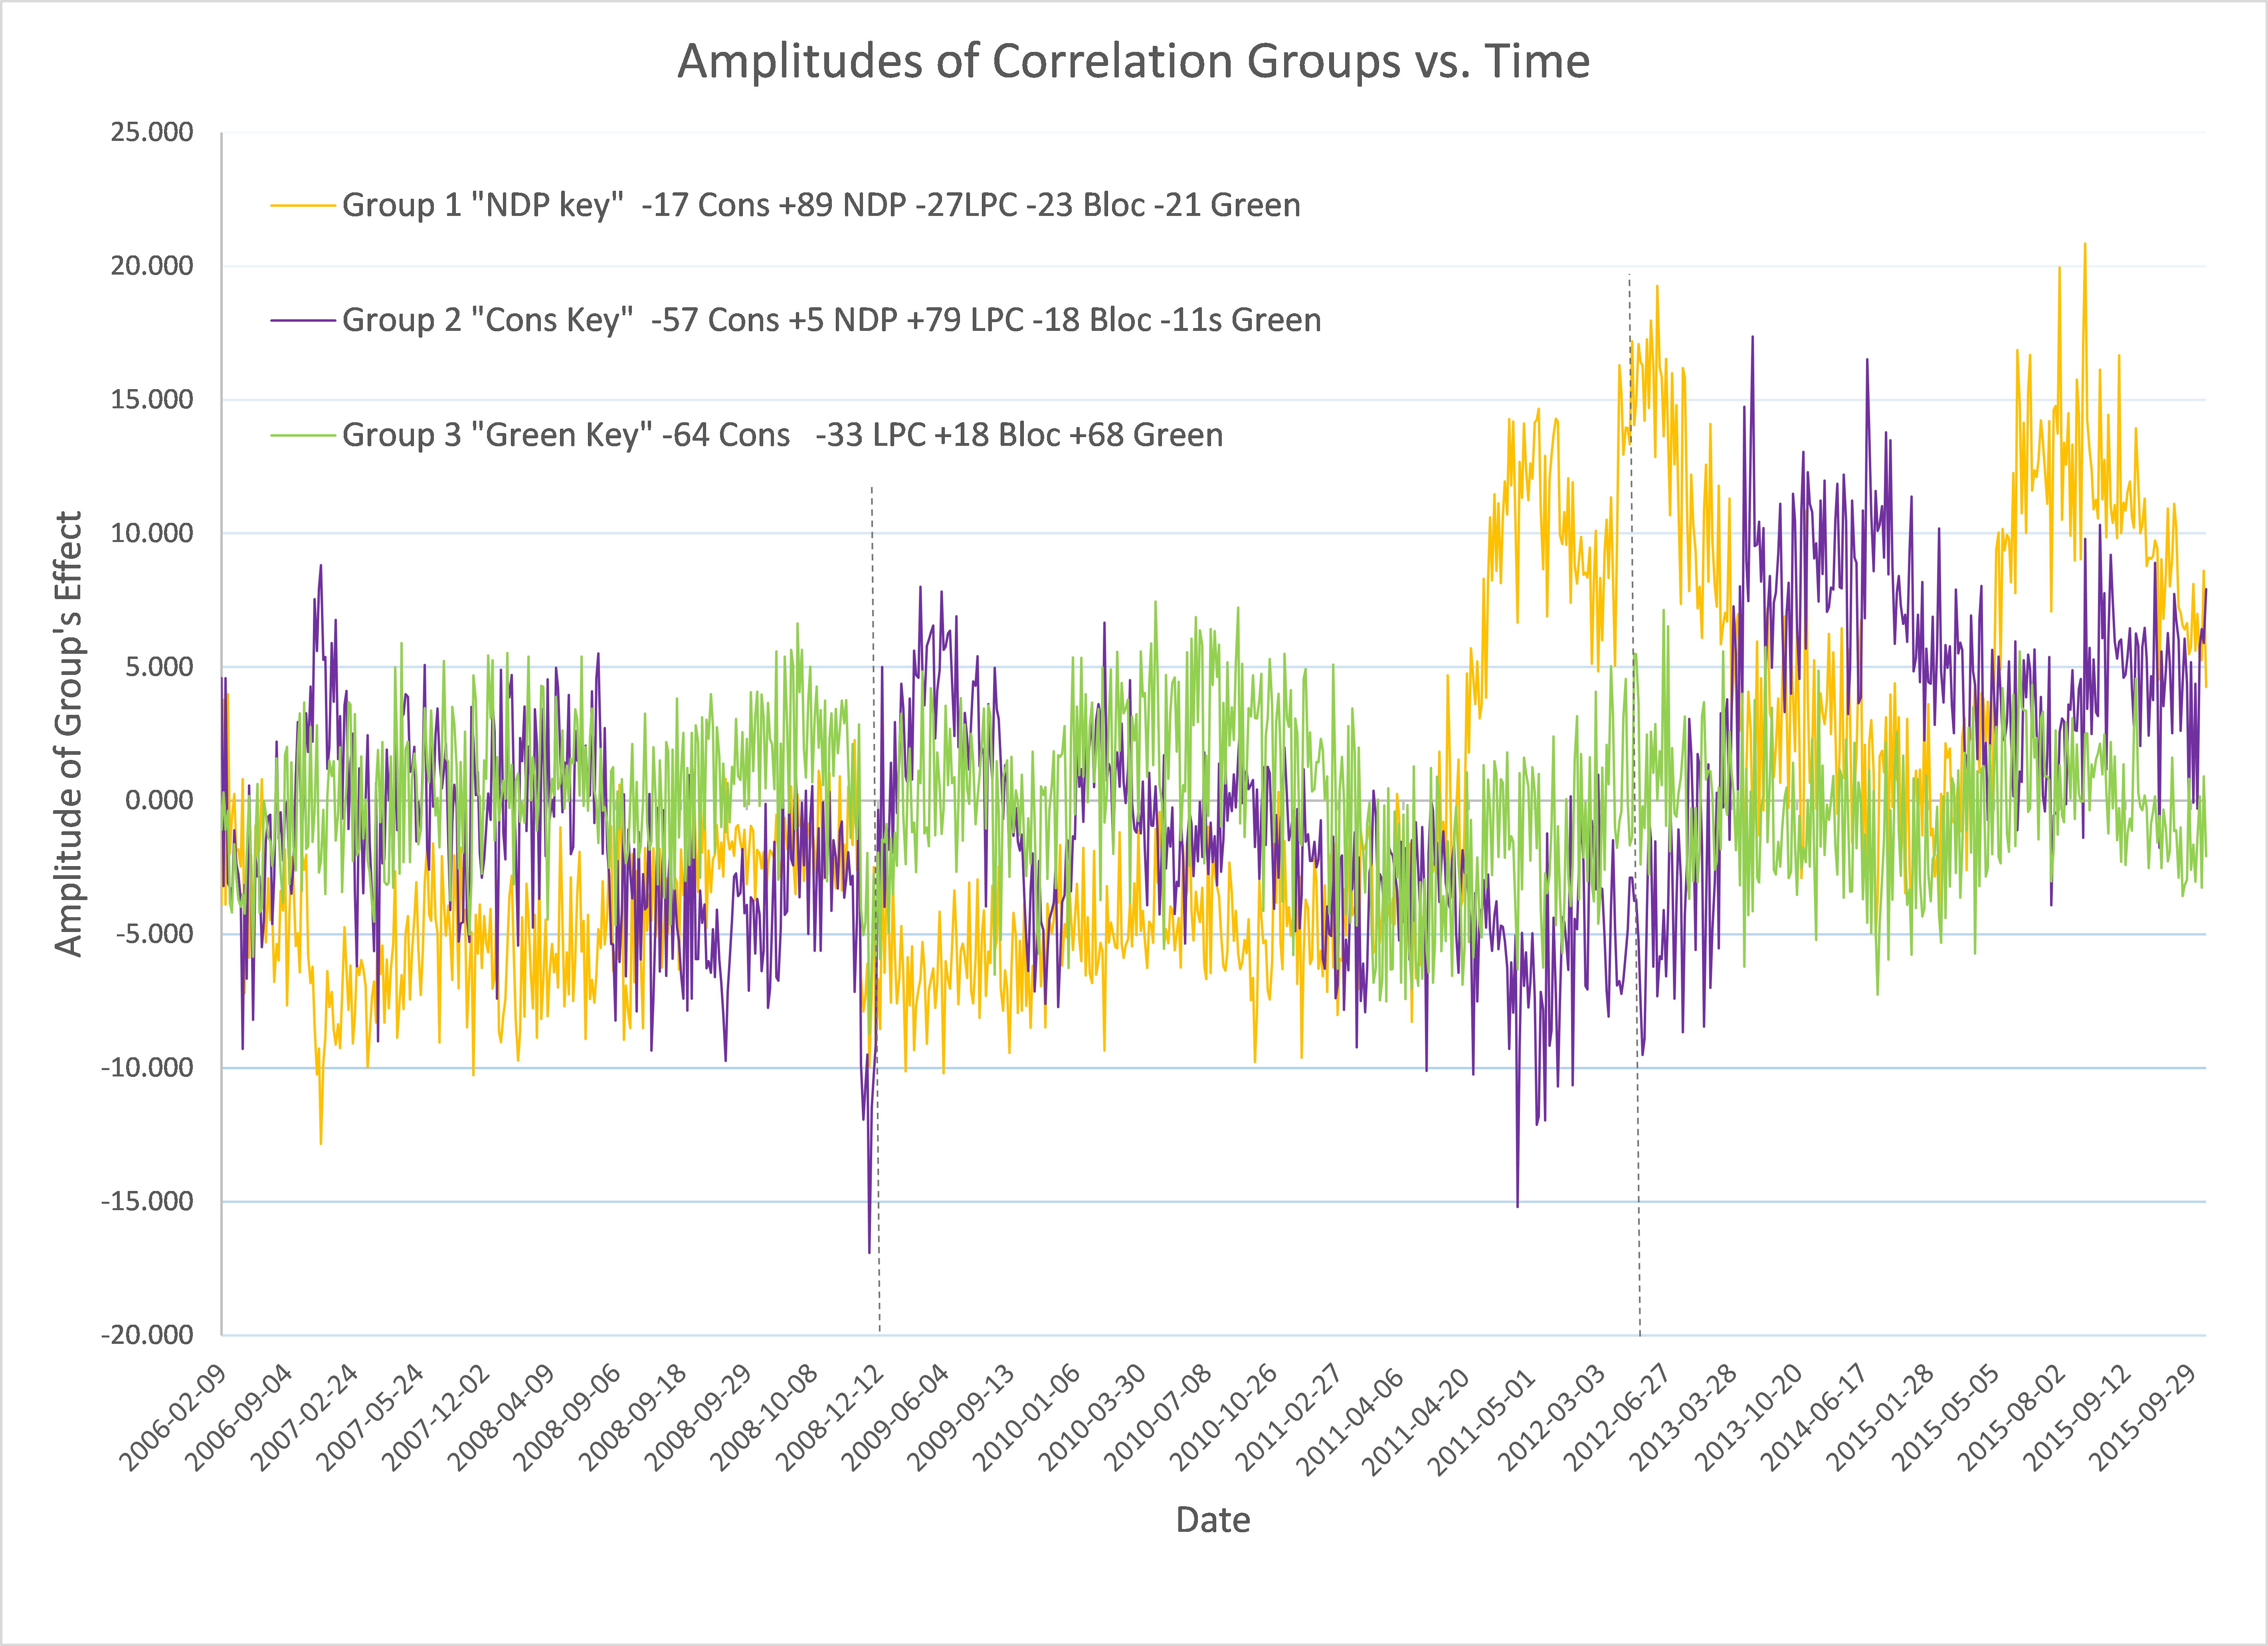
Figure 2 shows the amplitude (or contribution) of each group to the data set at any given time, over the period from 2006 to present. Most of the significant values of amplitudes have occurred since spring 2011. This could be described as increasing voter volatility. Group 1 dominated the volatility from April 2011 to April 2013 with the NDP’s surprise performance in the 2011 elections, at the expense of the LPC, Bloc, and Green Parties. The high positive values for the NDP Key correspond the 2011 election, the death of Jack Layton, and the election of Thomas Mulcair as the new leader. The presence of the Group 1 effect then dies down to zero until recently as we approach the Oct. 19 2015 election. The recent increasing influence of Group 1 has a similar lead up time to the 2011 election; however, the influence of the NDP key (Group 1) seems to have already peaked.
Group 2 (Cons Key) is dominant from April 2013 to present, starting with the election of Justin Trudeau as leader of the Liberal party. Support for the LPC comes primarily at the expense of the Cons at an almost 1:1 ratio. Except for some recent poor polling results, the popularity of Justin Trudeau has had a sustaining impact and has not exhibited the same rate of degradation as support for the NDP.
While the author of this work is more skilled in math and engineering than politics, he does highlight how these findings might suggest election strategies:
1) The LPC could enable the ‘help’ of the Bloc and Green Party to weaken the support for the NDP.
2) There seems to be little significant relationship between the voter’s choice between LPC or NDP and LPC or Cons. Therefore, winning support from the Cons party does not enable support for the NDP.
3) Justin Trudeau's leadership mostly impacted the support for the Cons. This also has not diminished. This may suggest an affinity the electorate for the Trudeau family name and traditional Liberal brand.
Future work.
Owing to time and financial restrictions, the scope of this work was kept small. This work could be extended to study a longer time frame and changing governments as well as individual provinces.